Issue 35 -- Results of the June Adjustment and Open Choice Enrollment Process
Beth Day takes a deep dive into the data from the recent June adjustment -- and from changes in SPS enrollment.
During the last week of school in June, Seattle Public Schools released revised enrollment projections that incorporated the results of the open choice process. In contrast to previous years, families were allowed to opt into any other school — both option and neighborhood schools — as long as there was physical capacity, with a promise from the district to adjust staffing accordingly.
A “June adjustment” is where the district updates its enrollment projections, and therefore school staffing allocations, for the upcoming school year from those made during the budget development process in February. Updated enrollment information that was not available in February, such as new registrations and open enrollment results, helps inform the adjustment decisions.
June adjustments have not been made by the district in recent years, resulting in a disruptive October adjustment that has come to be dreaded by families. This “October Shuffle” reconfigured established classes of students as schools gained or lost teachers after the October 1st student count reported to the State of Washington OSPI.
In response to community feedback, SPS did a June adjustment this year. The Bulletin obtained the results of the June adjustment from Seattle Public Schools and we present them in this article.
In this issue:
- June Adjustment Methodology
- Open Choice Enrollment Results
- Results by Grade Band and School Type
- Changing District Enrollment Patterns
June Adjustment Methodology
Seattle Public Schools sent us this document with information demonstrating which schools were impacted by staffing changes in the June Adjustment. SPS’s details regarding how the June adjustments were made and how they differed from prior year’s practices, are as follows:
“After initial allocations and previously approved mitigation were sent to schools in February, we updated staffing using the most current enrollment data, reflecting ongoing waitlist movement across schools.
Revised allocations align staffing to the most recent student enrollment projections, with additional adjustments for special education and multilingual program changes. General education updates affect classroom teachers and elementary specialists; counselors and social workers were not included. Special education changes apply to both teachers and paraeducators.
To avoid frequent minor changes, adjustments were not made where the difference was 0.4 FTE or less. School leaders reviewed these updates with their Regional Executive Directors to determine what is feasible in each school context, informing final staffing decisions. This information has been shared with schools and supervisors, and HR is supporting implementation.
As Superintendent Shuldiner noted in his cover memorandum to school leaders when sharing this information, making adjustments now helps reduce the need for in-year “October Shuffle” changes, which are more disruptive to students and staff.
Finally, we are moving away from the prior ±2.0 FTE approach and working toward more precise, formula-based allocations aligned to actual enrollment, with the goal of more predictable school budgets moving forward.”
We also asked SPS how the February and June enrollment projections were made. First of all, the district gave us details about the data used to make the projections:
“February and June enrollment projections are based on student assignment data by grade, program, and school, combined with historical enrollment (show) rates and student attrition trends. Assignment data reflects students placed through the enrollment and choice processes. Historical show rates estimate how many assigned students are expected to actually enroll, or "show" up the following year, while attrition rates account for student movement into and out of the district. Together, these factors are used to project enrollment for each school, grade, and program.”
Regarding how the methodology used to make these predictions differed for option schools versus neighborhood schools, the district said:
“Neighborhood (Attendance-Area) Schools: Projections rely primarily on geography and demographics. Key factors include neighborhood housing trends, local birth rates, current enrollment, and historical student progression by grade.
Option Schools: Projections rely heavily on market demand and application behavior. Key factors include student application numbers, waitlist activity, program popularity, overall building capacity, and historical acceptance and enrollment ("show") rates.
While neighborhood school numbers track local housing growth, option school numbers of tracked student choice patterns and the fluid movement of students shifting between local neighborhood schools and specialized programs.
Projection methodology for option schools also differed from previous years, largely because of the more open choice process and earlier timeline for open enrollment, with the district stating:
This year marks a noteworthy shift in how the district projects enrollment for option schools. Rather than relying primarily on historical enrollment lottery patterns, projections now incorporate real-time indicators such as applications, waitlists, and family choice data to better reflect current demand for specialized programs. This is, in part, possible because the district moved the choice process earlier.”
The district told The Bulletin that results of open enrollment/school choice were incorporated into the February and June projections, with the June projections giving “a more complete picture” because they incorporated “updated Choice Process data, including both the initial lottery assignments, family acceptance of offers, and student movement from waitlists that occurs throughout the spring.”
In previous years, because open enrollment happened later, these results were more difficult to accurately incorporate into the projections.
Open Choice Enrollment Results
SPS changed its policies around school choice and the open enrollment process in response to community pressure. The opportunity to submit an application for school choice was moved to earlier in the school year: January, with notification of the results on February 24th. Previously, open enrollment had occurred in February, with families being notified of the results in mid-April.
Waitlists were closed in 2026 on May 31st instead of August 31st as in prior years. As mentioned, the district also changed the enrollment maximum to building capacity and staffed schools accordingly.
The general results of the open choice enrollment process and June enrollment update are:
- 97% of students received a choice offer this year
- 83% of students participating in school choice accepted a choice they were offered (versus 64% last year)
- 59% of applicants were assigned to a choice neighborhood school and 41% to an Option school.
- Most option schools are projected to have increased enrollment over the 2025-26 school year, but enrollment was lower than anticipated by SPS
- Neighborhood elementary/K-8 enrollment is down district-wide (June projected enrollment 18,477 vs 18,745 in 2025-26)
The district-wide results of the open choice enrollment process were presented at the July 8th, 2026 school board meeting. (Click here to watch the meeting and read the transcript.) The Bulletin obtained additional information from Seattle Public Schools media relations.
Director of Enrollment Faauu Manu told the board that ~4,600 students participated in the school choice process and ~4,460 students received offers to a school that they requested, meaning 97% of applicants received a choice offer.
School Board Director Vivian Song asked whether “we know which percentage of those that received a choice offer actually took their choice?” Director Manu responded that 3,820 assignments were made from those placements offered, resulting in 83% of students participating in school choice accepting an assignment from that process.
SPS Media Relations also told The Bulletin that 59% of applicants were assigned a choice neighborhood school and 41% to an Option school.
When waitlists closed at the end of May (versus the end of August in prior years), only 282 students remained on waitlists, in contrast to 2025 where 1,100 students remained and 2024 where 2,000 students remained.
Using the data from the last available Waiting List Summary from May 29th, I calculated some further details. 82.2% of the students remaining on the waitlist were hoping to attend schools that were at or near capacity (>95% of the operational capacity in the 2025 Facilities Master Plan Update). All of the remaining students on the waitlist were special education students looking to attend schools with physical room.
In total, 23.5% of all students remaining on the waitlist as of May 29th were special education students, including those wanting to attend schools at maximum capacity. Waitlist and capacity data calculations can be viewed in my datasheet.
Results by Grade Band and School Type
For each grade band/school category, a bar graph displays the June 2026 FTE Count from the P223 Enrollment Report, the February Student AAFTE Projection, and the updated June Student AAFTE Projection. The detailed results can be viewed in this datasheet, which is sorted by schools with a neighborhood attendance area versus those without, then by change between last year’s enrollment and the June projection. I included the difference between last school year’s enrollment and the June projection.
While some schools lost teachers after the June adjustment, these teachers may be above the 2025-26 school year staffing because the district overprojected growth at these schools in February. Staffing is directly tied to enrollment. Unfortunately, SPS has no public data about final 2025-26 staffing after the October adjustment, so I can’t accurately compare staffing from year to year.
Each grade band also has a map showing the geographic distribution of teacher adjustments (left) and the difference in enrollment projections between February and June (right). You can also use the layer list in the upper right corner to change the displayed layer to the difference between last year’s enrollment and the June projection (click on the arrow next to “Enrollment Difference” to expand the layers).
High Schools (9-12)
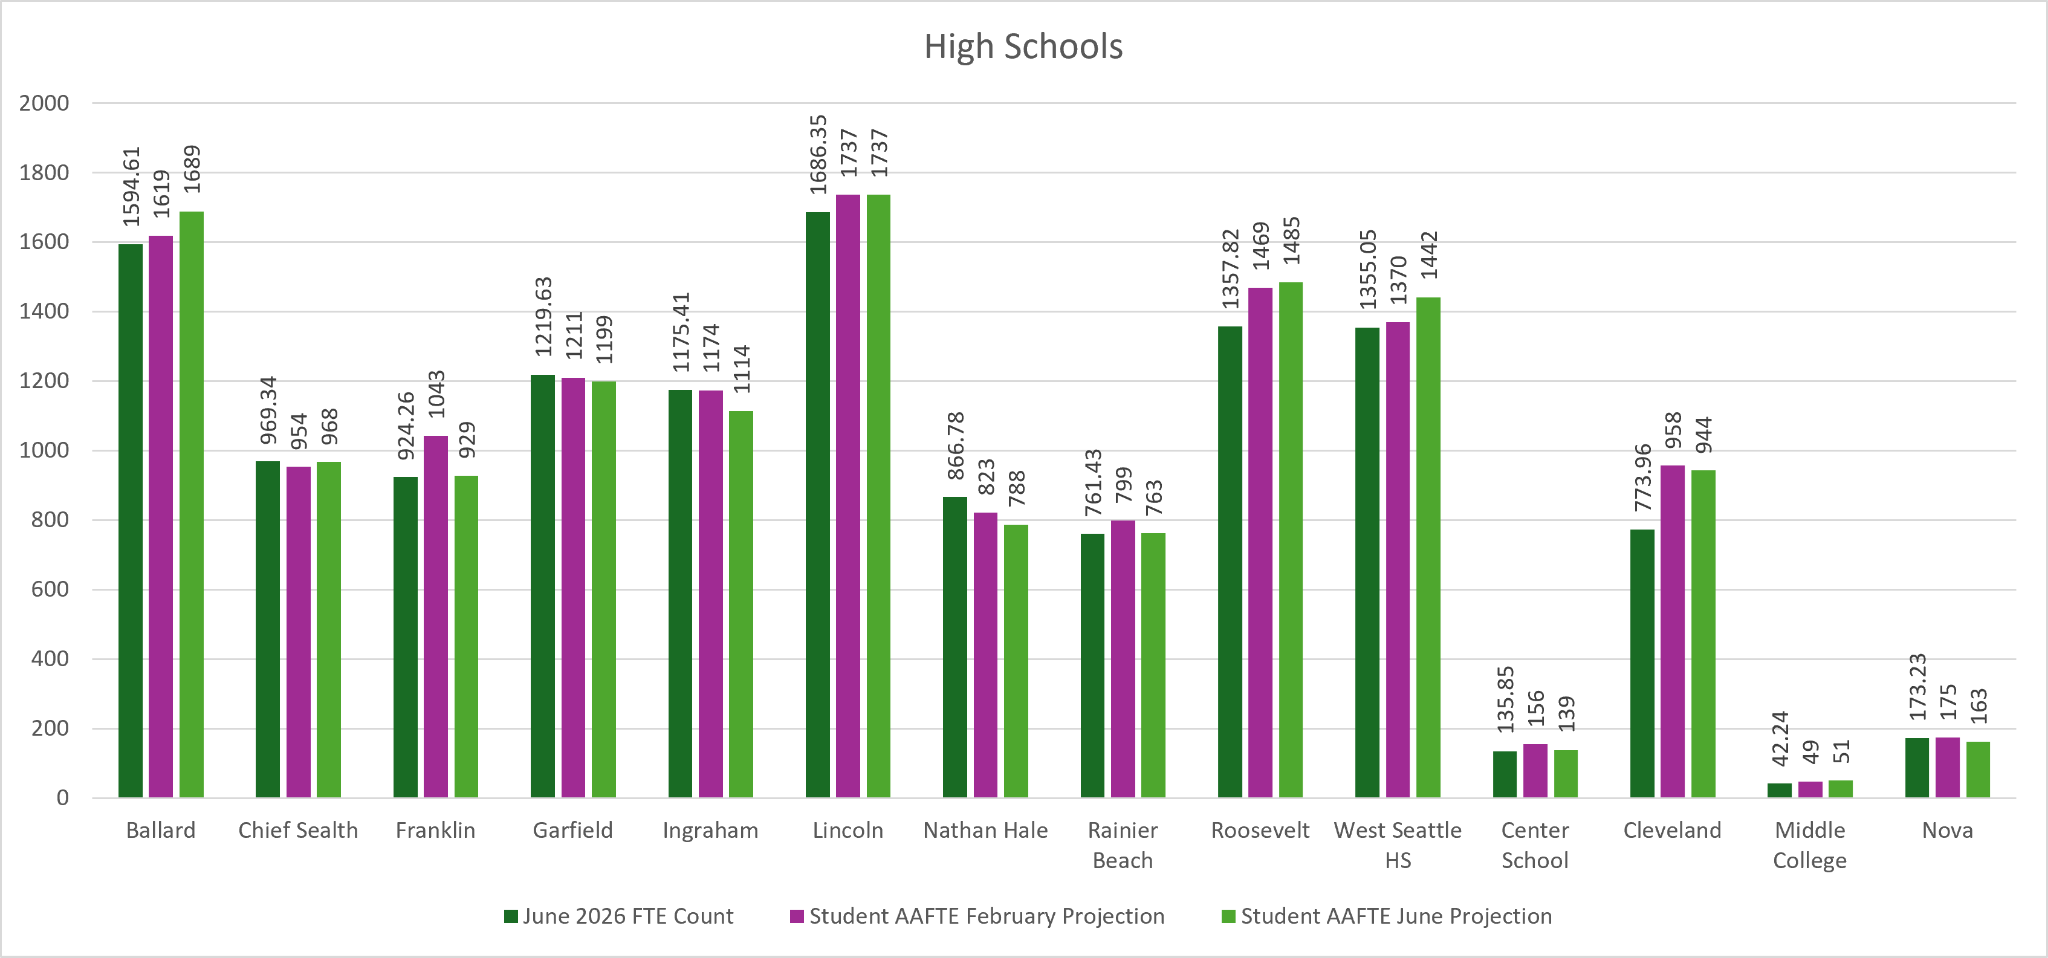
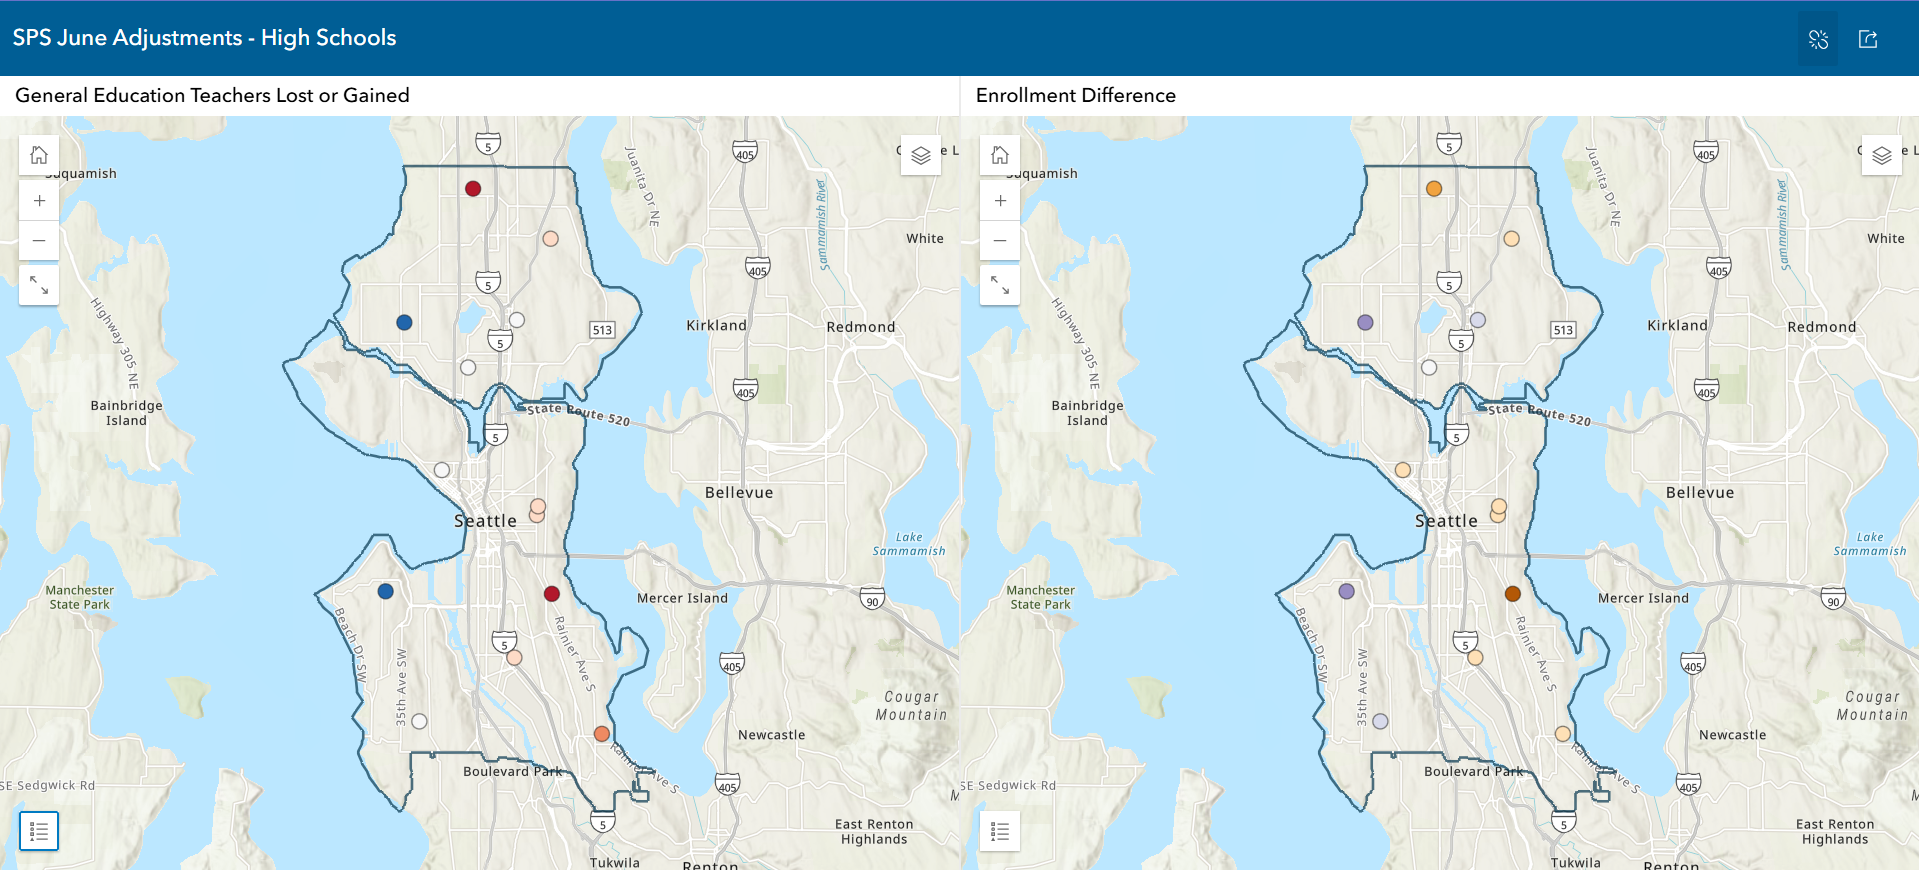
The most drastic change between the February and June projections among the high schools was at Franklin: a loss of 114 students and a loss of 4 teacher positions from the February allocation. However, the June projection is still 4.7 students above the June 2026 actual enrollment. Nathan Hale, Ingraham, and Garfield saw losses of students in both the change from February to June projections as well as from last year’s enrollment.
Unanticipated projected growth seems to have occurred at West Seattle and Ballard after the choice process (gaining 2.6 teachers each) and both schools are now close to capacity (>95%). Enrollment staff appear to have anticipated growth over this year’s enrollment at Roosevelt (127.2 students over last year’s enrollment).
Similarly, SPS appears to have predicted increased demand through the choice process for Cleveland STEM, adding 170 students over last year’s enrollment. Enrollment at Lincoln remains strong, and appears to be limited by capacity (stated as 1600 students in the 2025 Facilities Master Plan Update).
During the July 8, 2026 School Board Meeting, Superintendent Shuldiner highlighted the increase in retention between 8th grade and 9th grade:
“We’re actually getting more kids into 9th grade than were in our 8th grade. So we know that our high schools are a big draw. We want to make sure that our high schools are open and that people can come back to us.”
Statistics shared at the meeting indicated a 100.6% enrollment rate of rising 9th graders compared to graduating SPS 8th graders, indicating that some 9th grade students were not SPS students in 8th, which may contribute to growth at some high schools.
Middle Schools (6-8)
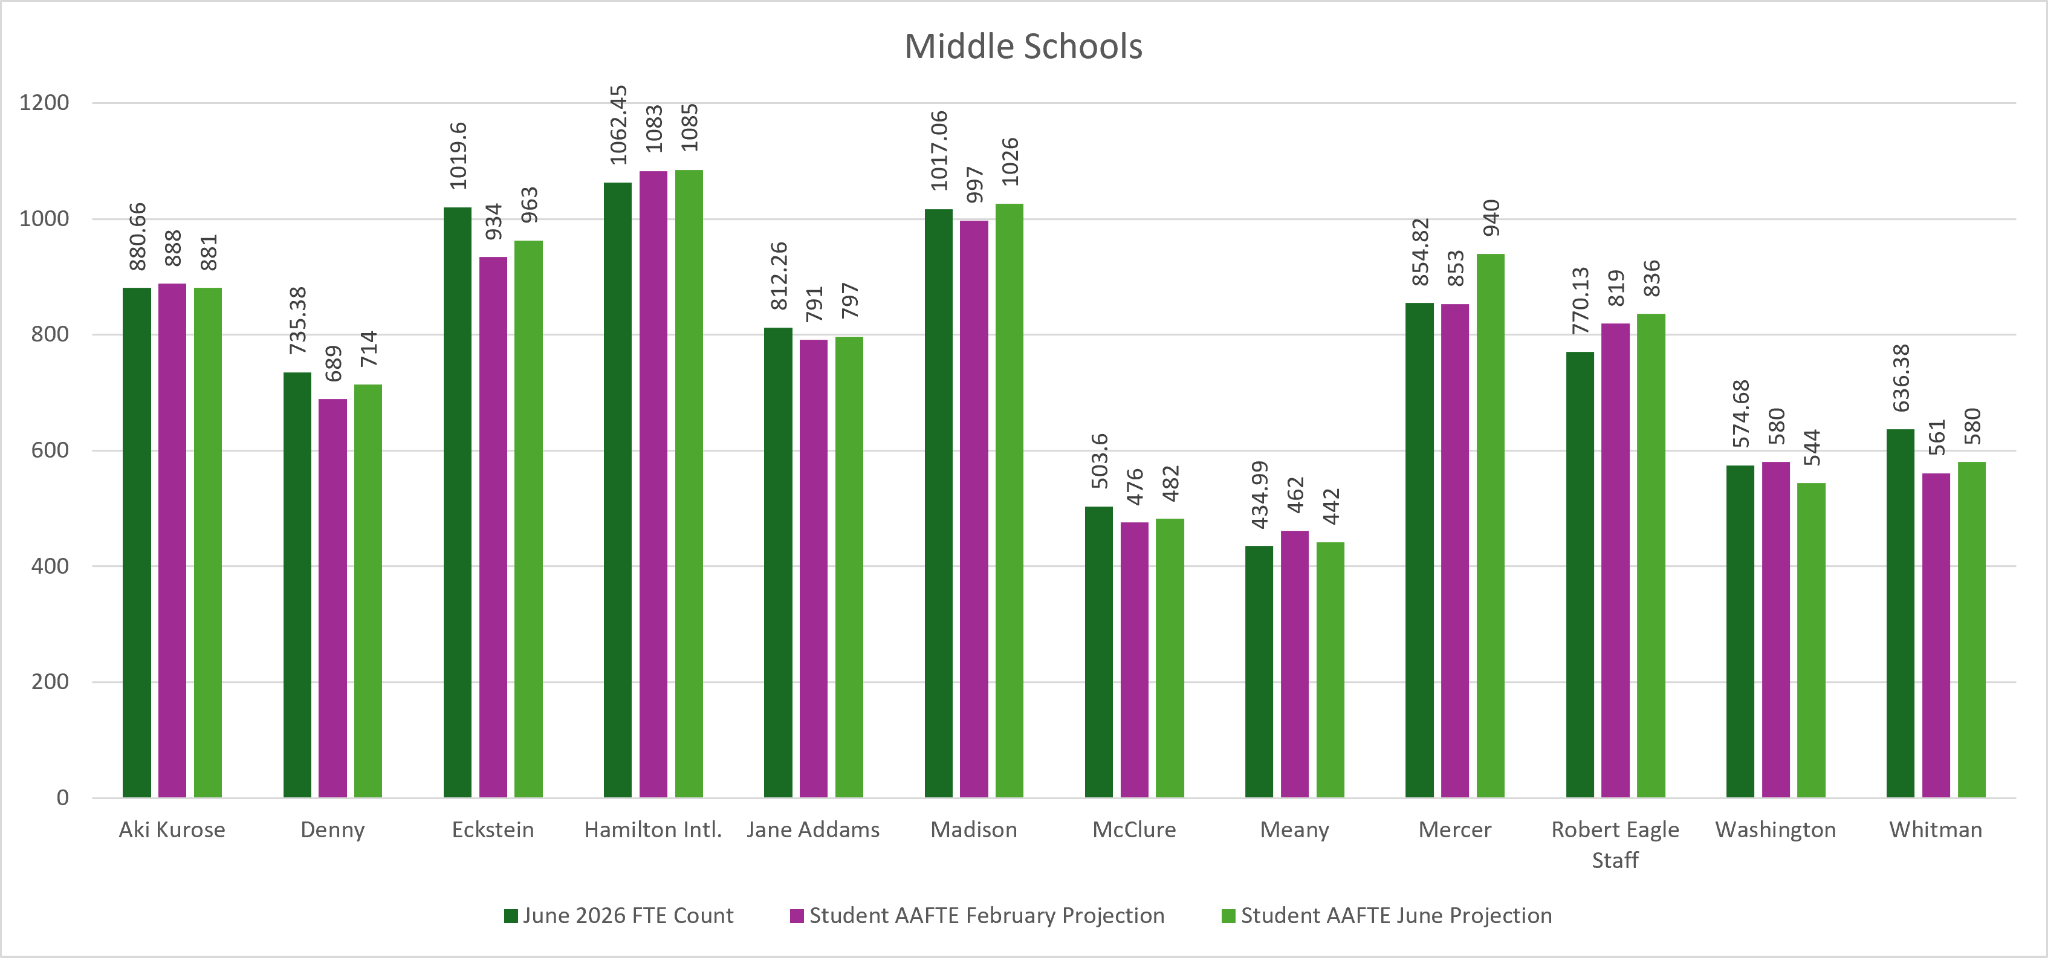
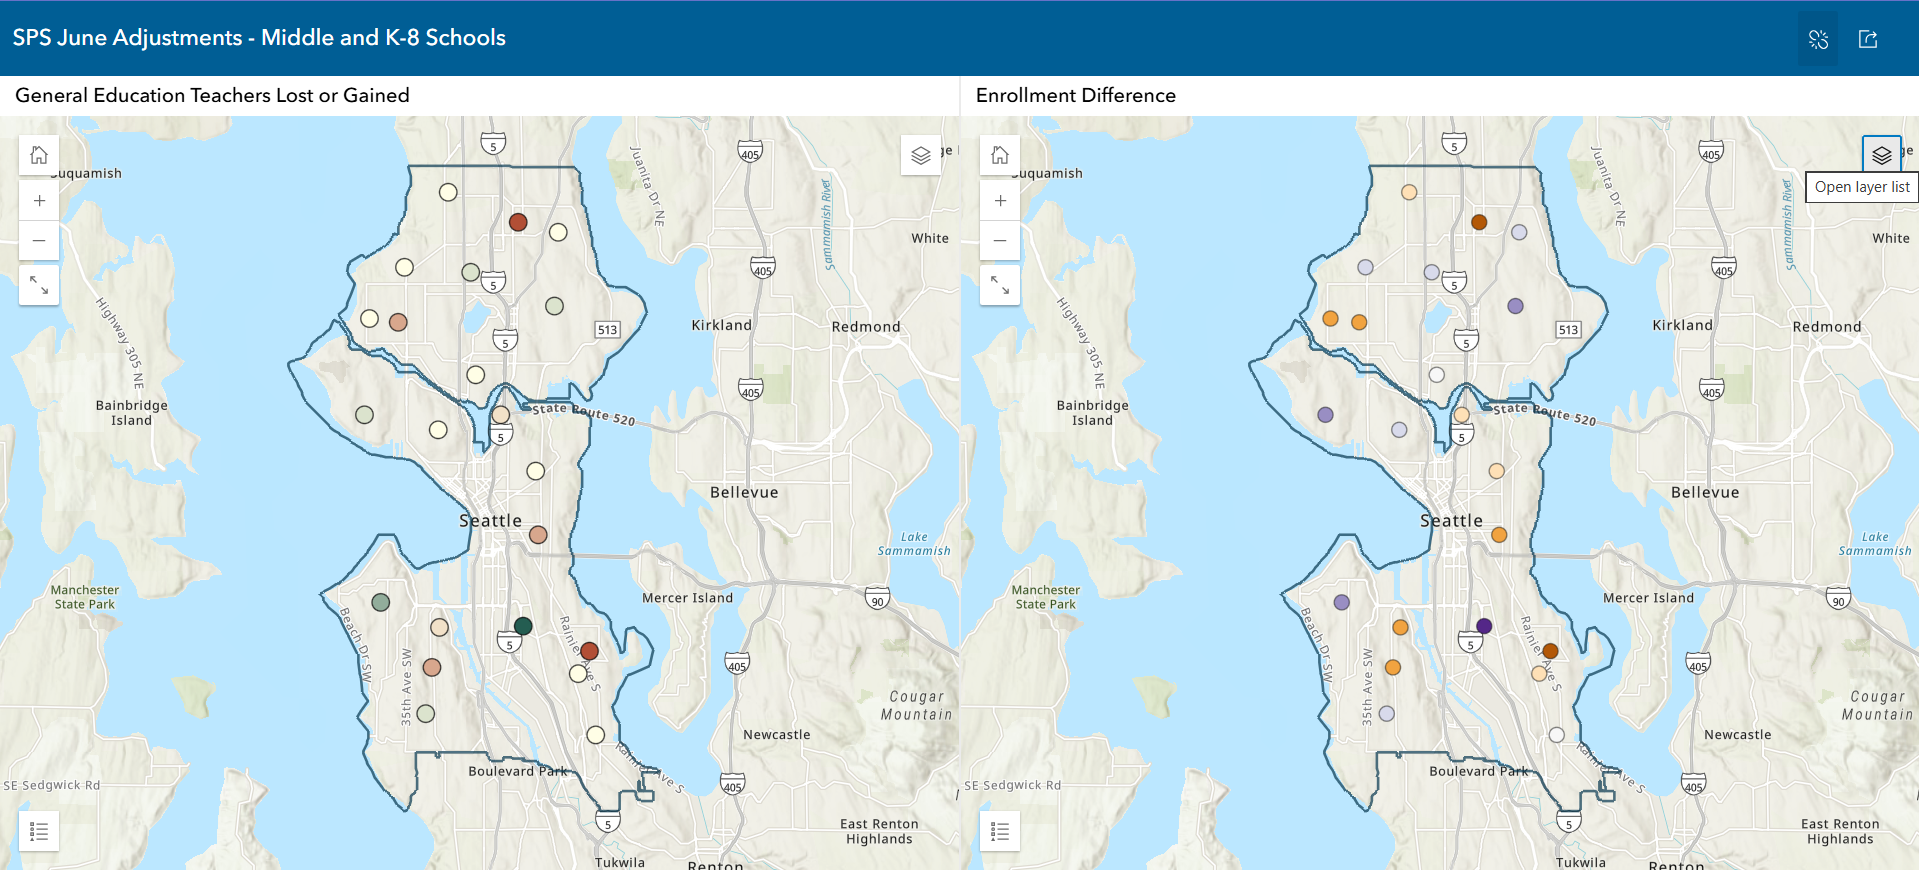
Eckstein (-56.6 students) and Whitman (-56.4 students) are projected to lose the most students next year versus 2025-26 enrollment, but made modest gains compared to their February projections. Washington lost students compared to last year’s enrollment (-30.7 students) and between the two enrollment projections (-36 students), resulting in a loss of 1.4 general education teachers.
Mercer (85.2 students) and Robert Eagle Staff (65.9 students) gained the most students in the June 2026 enrollment projection versus 2025-26 enrollment, but the growth at Mercer appears to have been unanticipated by SPS staff (87 students more than projected in February), adding 3.2 general education teachers.
Superintendent Shuldiner signaled his intentions to focus on middle schools during his tenure, stating at the July 8th school board meeting:
“But you can see that the focus really needs to be on our middle schools, because even though the numbers have gotten a little better from 92 to 92.3 [%], that still means that almost 8% of our 5th graders are leaving the district. And so, that’s why a lot of focus is gonna be on middle schools in terms of what we’re gonna do to support those programs.”
Neighborhood Attendance Area K-5 and K-8 Schools
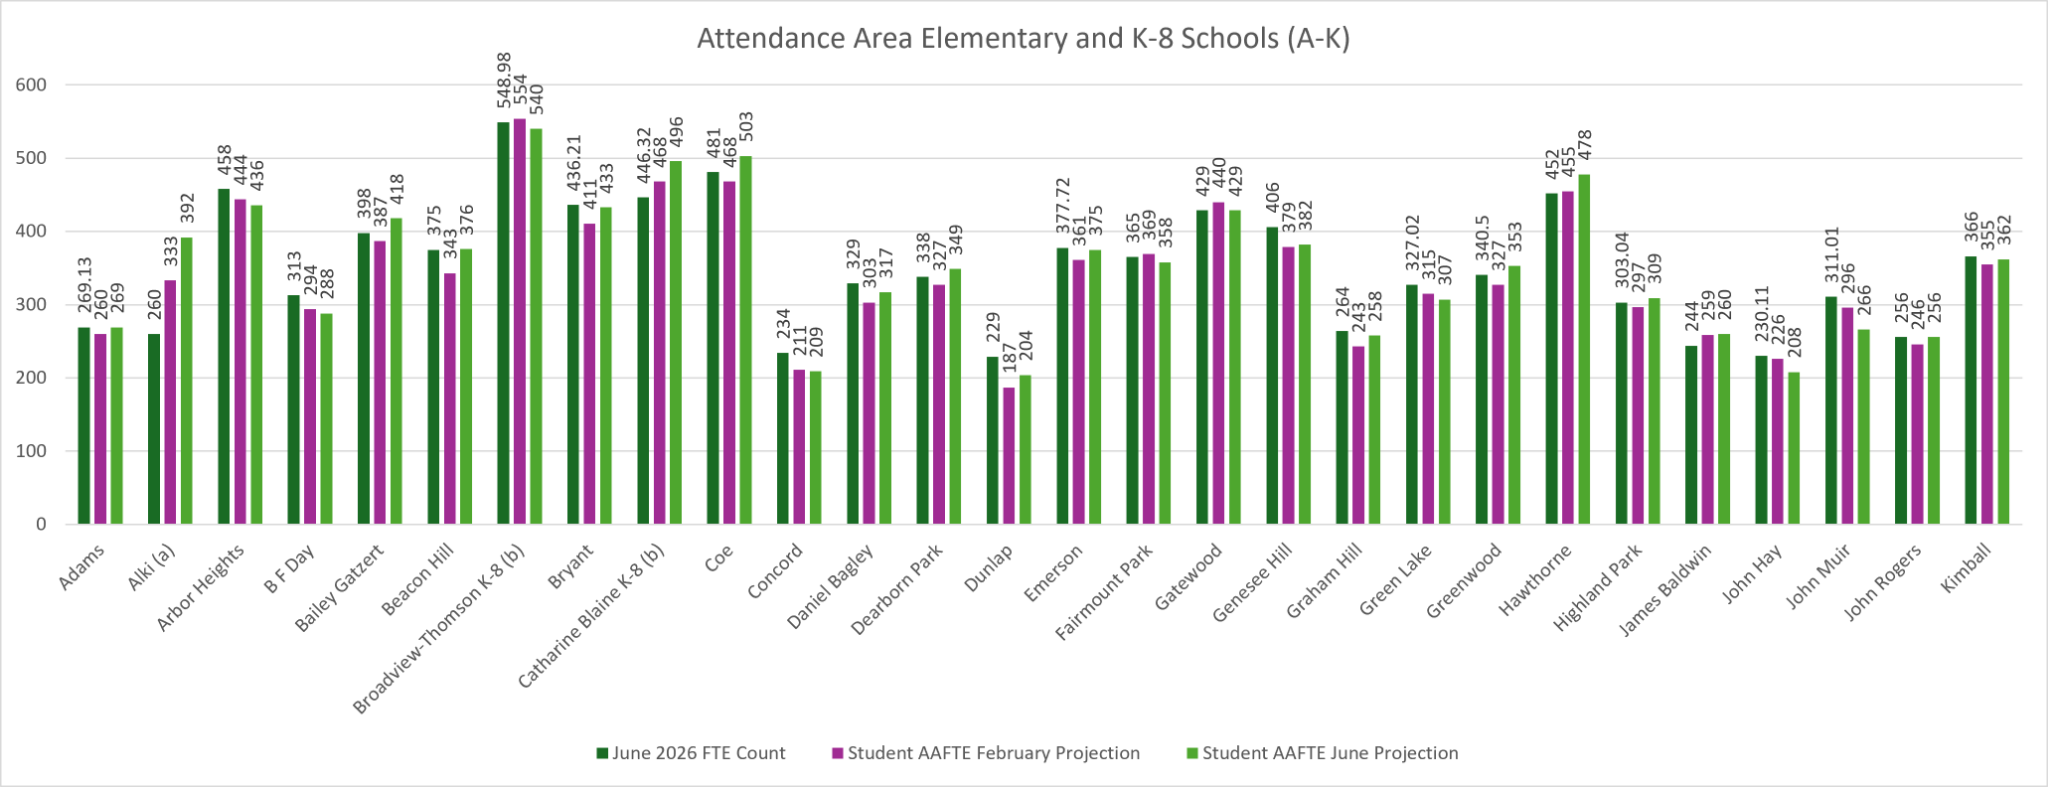
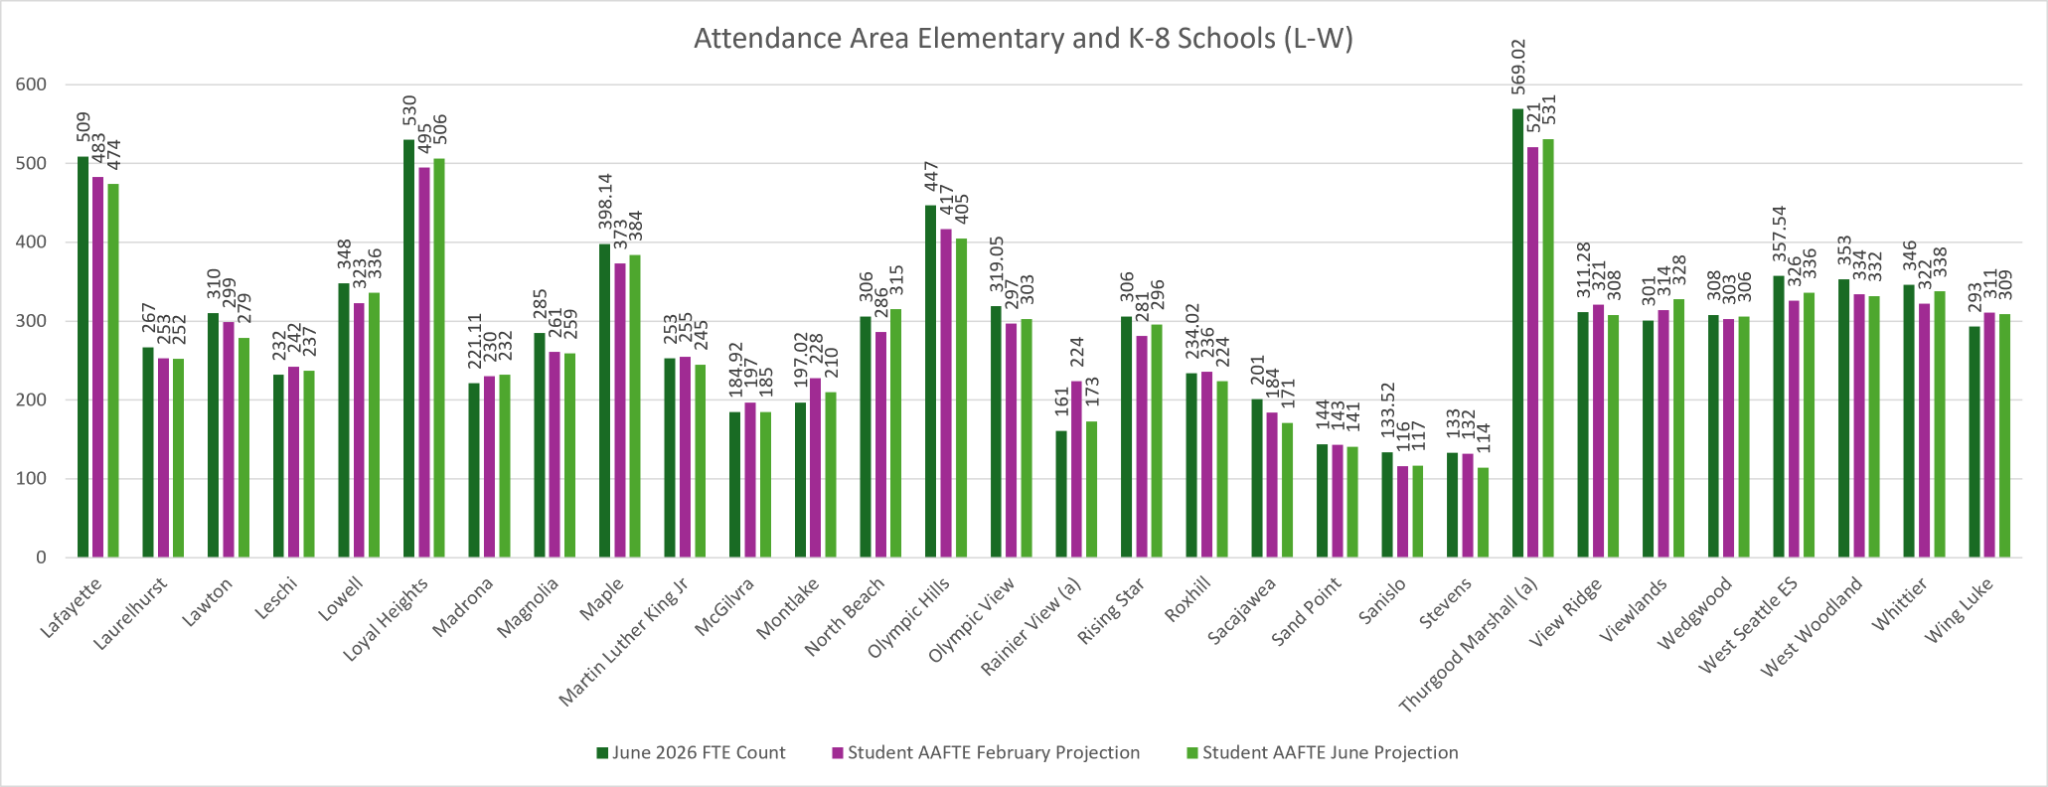
Schools marked in the above chart with an (a) have HCC cohorts co-located within a neighborhood attendance area school. Schools marked with a (b) are K-8 neighborhood attendance area schools.
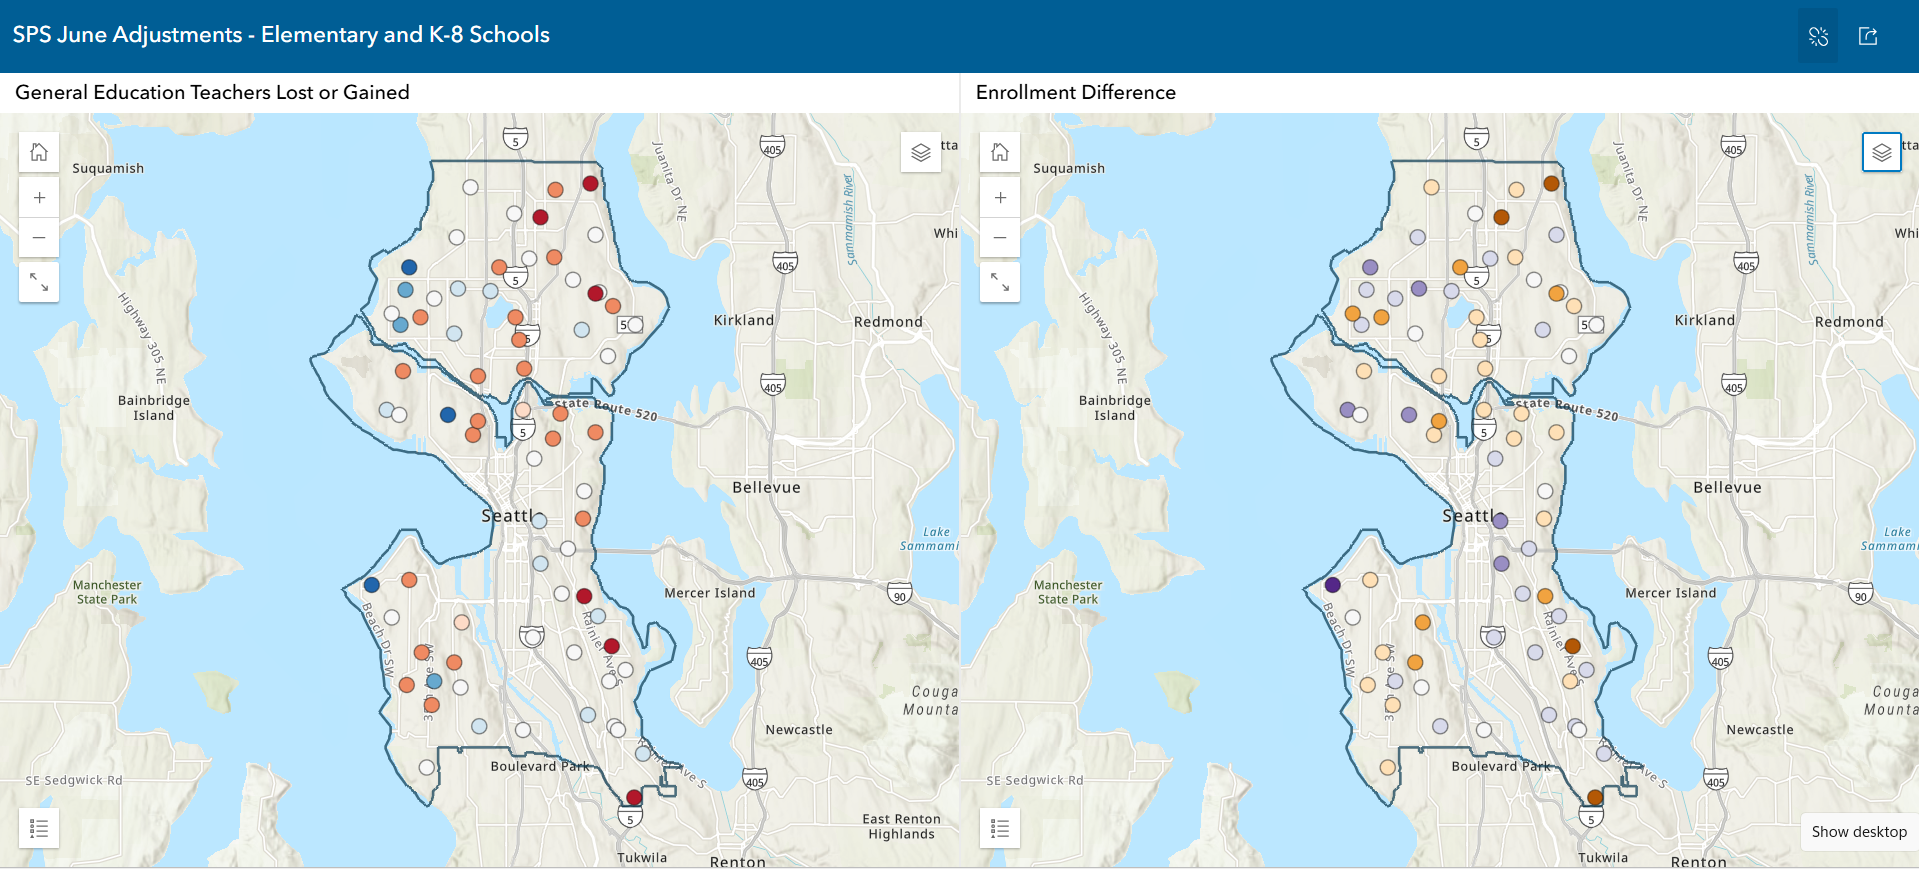
My general observation regarding neighborhood attendance area elementary and K-8 schools is that many, but not all, schools are projected to have lower enrollment next year. Two-thirds of the neighborhood schools are anticipated to have fewer kids enrolled next year (2026-27) than were enrolled last year (2025-26). As a result, many schools are losing a teacher (or more).
Some schools that are projected to grow compared to their 2025-26 enrollment include Alki, Bailey Gatzert, Catherine Blaine K-8, Coe, Dearborn Park, Hawthorne, North Beach, and Viewlands.
Alki is predicted to have notable growth in the June projections, both over current enrollment (132 students over) and over the February projection (59 students over). In the 2025-26 school year, 32 Highly Capable (HC) students were enrolled according to OSPI data. According to data presented by the enrollment department to the school board on July 8th, 125 HC students were projected to be enrolled at Alki.
Rainier View, the other new HC site, appeared to have less of a boost from HC enrollment, gaining 12 additional students compared to June 2026 enrollment. The June projection revised enrollment down by 59 students compared to the February prediction, resulting in a loss of 2.5 general education teachers. There were 12 HC students enrolled at Rainier View during the 2025-26 school year and the enrollment team at Wednesday’s meeting projected 27 HC students for next year.
School Board Director Jen LaVallee spoke at the July 8 board meeting to this contrast between the two sites:
“I’m looking at the HC pathway site enrollment and Rainier View has 27 students attending it next year, something that I was nervous about when we took the vote many months ago about that issue, because the way the area was constructed has less qualifying students in it than the other areas.
And it’s a site that’s kind of far away in the opposite direction of people going to work or going to wherever they’re going at the same time.
So I’d love to know within looking at Alki has 125 out of how many qualifying students, Rainier View has 27 out of how many qualifying students.”
Superintendent Shuldiner responded by saying, “You are correct to highlight that one of the locations that was chosen seems to not be a place where folks are sending their kids, even if they live within that community and are eligible.”
A conversation at that same board meeting between School Board Director Liza Rankin and Superintendent Shuldiner discussed how in previous years, there were unanticipated students showing up in the fall at elementary schools. Rankin said:
“Do we anticipate any sort of, like readjustment in August? So a couple of years ago, I volunteered as a Kindergarten IA for the first week of Kindergarten, because they had 16 kids who showed up who hadn’t registered ahead of time. That was an extreme example, but that can happen, so are we in a position, are we thinking about, if we don’t want to completely set everything in stone because we do have the state count on October 1st, that matters for funding.
But if we find in the fall that things don’t go as we expected and there’s a school that like, wow, could really use another Kindergarten class, are we going to be in a position to be able to address that when the kids show up, instead of waiting until October?”
Superintendent Shuldiner responded:
“One of the promises that I had made in terms of the certificated staff for the district was, with our changes, we weren’t going to let go of the certificated teacher staff. So we have some teachers in a pool that we’re going to be holding onto to make sure that if there are extra kids onto places, we can actually move some of our staff.
We also know that those wonderful teachers can help us with long-term absences, people taking leave, things like that.
We appreciate that this is a big city with 800,000 people and lots of moving parts. It is quite possible that over the summer, 20 families move in from Texas because it’s too hot there and they love the Pacific Northwest, and we should be able to adjust accordingly to that. But the good news is, the structure I think is going to hold because of what we’ve set up over these last couple of months.”
We will see in the fall if this new system is more flexible. In both this year’s June adjustment, as well as past “October Shuffles,” families have seen how the “hard edges” (as Superintendent Shuldiner calls them) of the Weighted Staffing Standards can lead to the addition or loss of teachers with the gain or loss of just a handful of students.
Option and HCC Cohort Schools (K-5, 2-5, K-8)
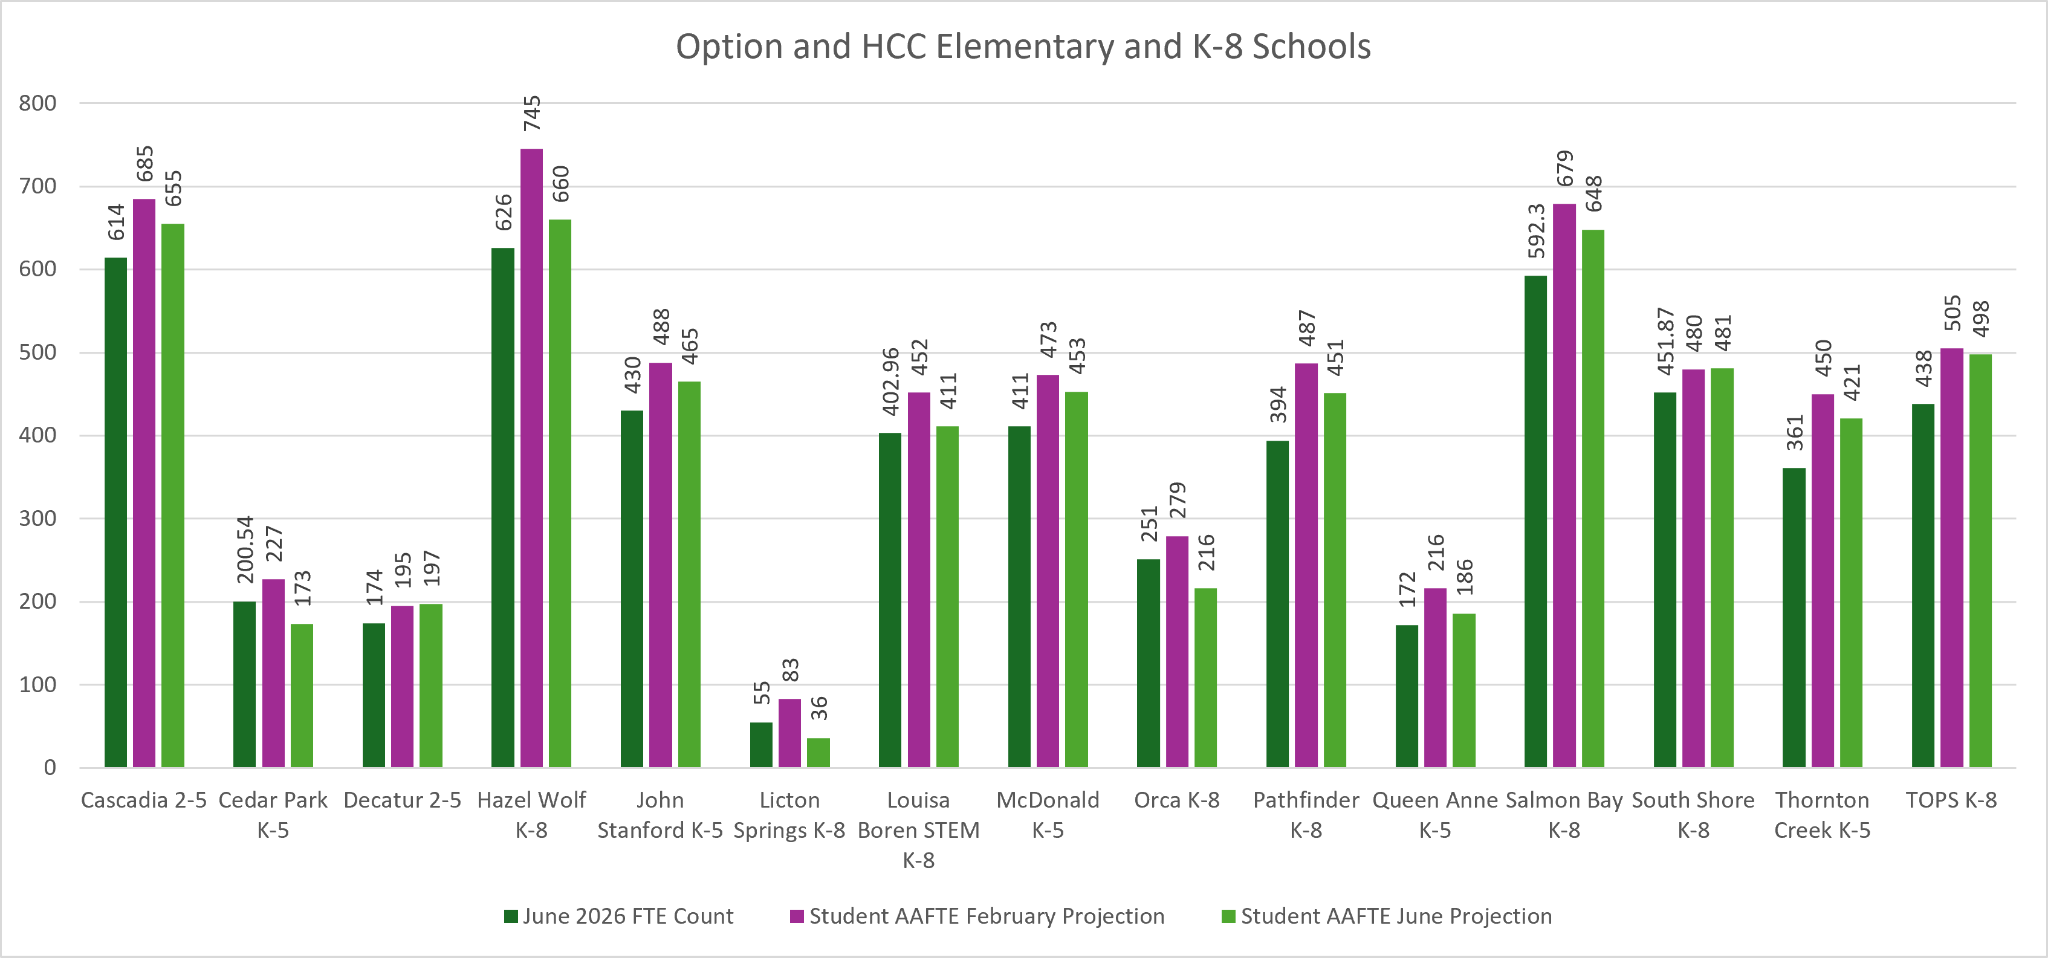
Many Option schools increased their enrollment over 2025-26 school year enrollment as a result of raising the enrollment cap to the physical capacity of the buildings. Unfortunately, Orca K-8, Cedar Park, and Licton Springs K-8 are each projected to lose more students than predicted by the February projections, as well as compared to last year’s actual enrollment.
Director Fauu Manu noted the lower than expected enrollment at choice schools at the July 8 board meeting, stating that “applications were a little soft in some of our option schools, that we anticipated more mobility, that they were going to apply for more high demand schools, didn’t pan out.”
Board Director Vivian Song commented at that same board meeting on the tension in the choice process between parents selecting option schools versus a neighborhood school other than the one for which they were zoned. Song said:
“I think a lot of this discourse has been kind of hinging on this idea that option schools draw students away from neighborhood schools and what I found interesting once we looked into the data was that about half of our applicants are actually for neighborhood schools.”
More families chose another neighborhood school besides the one to which they were assigned than chose option schools during open enrollment, as seen in the choice results discussed above (59% opting for neighborhood schools versus 41% for an option school).
Changing District Enrollment Patterns
Another topic of discussion during the July 8, 2026 board meeting was the effect of the more open choice enrollment process on low enrollment schools. Director Manu summarized these changes and concerns during her initial presentation, saying:
“It's really important to have this conversation especially with the school board because there's some governance that needs to happen. So school choice is a board policy. We have it every year unless you decide not to. We're going to continue to offer students what they want and we're going to continue to find the space so that we can maximize those opportunities for our families.
It's not okay to say, hey, we're going to hold to protect another school as far as unenrollment. That was past practice. And the equity piece is that every student deserves to go to where they want to go to feel successful, and so we can provide that. We have plenty of schools to choose from, actually, and options.
What really is daylighting the concern I think you are raising is those demographic shifts that are already happening in those low enrollment schools. They are already there. The school choice expansion just daylighted that for us.
And so to inform all of you as far as my job is to say, hey, here's some of the regions that are below 60% of their capacity or whatever that threshold is and so it's a conversation about what do we do next because it's still not okay to continue to have them be depleted and it's not because of school choice, but it's a residual of maybe untimely governing, I don't know, right?
So I just want to make sure that we understand that school choice is access, and if we're going to continue that, how do we come together as leadership to say, “Where are these areas and regions and what do we do as far as investing in these strategies going forward in helping these neighboring regions?”
The effects of opening up school choice from staffing capacity to physical building capacity, and ending policies in the past that protected enrollment at smaller schools, remains an open question. I hope that the district will publish data about where students attending each school live, as they have in past years, so we can get a better sense of where these enrollment shifts are happening.
I anticipate this continuing to be a topic of discussion for the school board, especially within the newly formed Operations Committee, as they are tasked with the work on the Student Assignment Transition Plan, which is the board policy that governs school choice.
Special thanks to my fellow “SPS Data Nerds” who provided me with advice and guidance on this analysis.